Last month I posted my predictions for 2014 real estate. The data for 2013 is now in, and here’s a summary of how the Seattle housing market did last year. I’m happy to provide you with a neighborhood or other city report if you’d like; just send me an email and what are you’d like market data for.
2013 was a very successful year for real estate in Seattle. Inventory of homes, while still low, improved significantly, resulting in a 16% increase in closed sales on single family homes and 15% on condos. A balanced housing market would have 5 to 6 months of inventory of homes, and Seattle is still lagging far behind that, at 1.6 months in December. January is a fabulous month to bring a home on the market, before the typical spring increase, as buyer demand is high. With high demand and low inventory, it is definitely a sellers’ market. Just two weeks into January, anecdotal reports are huge numbers of people attending open houses (even during Seahawks games). Single family home prices citywide were up 13%. While condos didn’t see as much appreciation, they are selling significantly faster, down from an average of 98 days on the market to 65. Lastly, foreclosures and short sales are disappearing, only 9% of single family home sales and 18% of condo sales. This decrease is due to homeowners’ increased equity, and is expected to continue through 2014.
Tied for the most expensive home sold in Seattle in 2013 at $6,500,000 were two homes, one in Denny Blaine and the other in Laurelhurst. On the other hand, the lowest priced sold home in Seattle was $65,000, a bank-owned property in the Rainier Valley. A penthouse condo in Escala downtown was the highest priced condo sold, at $6,200,000. A studio co-op had the lowest sold price for a condo, at $55,000.
Seattle Single Family Homes (including townhomes), 2012-2013
| 12/31/13 | 12/31/12 | Change | |
| Average Sales Price | $520,829 | $460,667 | + 13% |
| Median Sales Price | $444,950 | $399,500 | +11% |
| Homes Sold | 7,753 | 6,656 | + 16% |
| Average Days on Market | 36 | 61 | – 41% |
| Selling to List Price Ratio | 100.9% | 99.1% | + 1.8% |
| Foreclosures & Short Sales – Number | 704 | 1217 | – 73% |
| % of all sales | 9% | 18% | – 50% |
| Months of Inventory | 1.6 | 2.3 | – 30% |
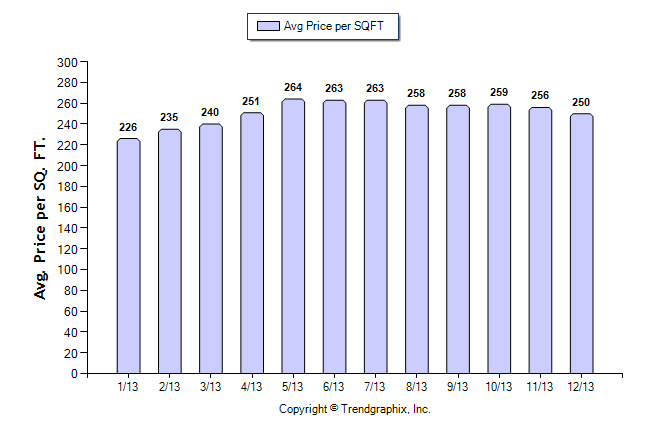
Average price per square foot increased 11% in 2013, from $226 in Dec. 2012 to $251 in Dec. 2013.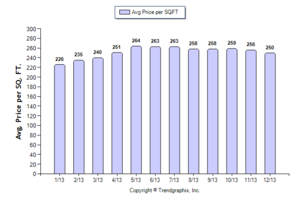
Seattle Single Family Condominiums, 2012-2013
| 12/31/13 | 12/31/12 | Change | |
| Average Sales Price | $340,924 | $333,504 | + 2% |
| Median Sales Price | $280,000 | $247,000 | + 13% |
| Homes Sold | 2,535 | 2,203 | + 15% |
| Average Days on Market | 65 | 98 | – 34% |
| Selling to List Price Ratio | 99.3% | 97.9% | + 1.4% |
| Foreclosures & Short Sales – Number | 462 | 611 | + 24% |
| % of all sales | 18% | 28% | – 36% |
| Months of Inventory | 2.3 | 3.5 | – 34.2% |
Average price per square foot increased 4% in 2013, from $340 in Dec. 2012 to $353 in Dec. 2013.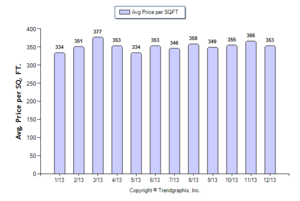
As always, please feel free to contact me at anytime with questions or for more detailed statistics. I am here to help you and your friends/family in purchasing or selling their real estate. I appreciate all your referrals, thank you!